
On 4 February 2020, a long grid on BTCUSDT opens with $10,000 of margin, entry $9,330, range $6,228 to $13,865. Five weeks later the March crash arrives. The version running at 3× buys the whole way down, sits fully invested through the bottom, and closes the 90 days at +13.1 %. The version at 5× is the same bot on the same candles. On day 38, at −59.5 % from entry, its margin is gone.
That is the one liquidation in this study. Out of 70 windows.
The question this leaves is not "how do I avoid liquidation". It is: if a leveraged grid almost never gets liquidated, what does the leverage actually do to it?
The setup, in numbers you can check
- Data: Binance spot candles, 15 minutes, BTCUSDT and ETHUSDT, 17 Aug 2017 to 31 Aug 2026. 316,411 candles per pair, 0.18 % missing.
- Windows: 35 disjoint 90-day windows per asset, the first starting 16 Nov 2017, the last ending 2 Jul 2026. Same windows as the September grid study.
- Range: last close before the window ± 1.5 standard deviations of the previous 90 days, scaled to 90 days. Built only from data available before each window.
- Bot: long grid — starts 100 % in cash, buy orders below the entry, each buy spawns a sell one level up. 50 arithmetic grids, 0.075 % fee, entry at the window's first close. The same engine as the grid backtest on this site.
- Leverage: 1×, 2×, 3×, 5×. Isolated margin at bot level: $10,000 margin, the grid trades margin × leverage. Liquidation when the equity at the candle's low, with the position after the buys down to that low, falls below 0.5 % of the position. The margin is the most you can lose.
- Funding: BTC from the recorded daily average of Binance, Bybit and OKX (before September 2019 a flat 0.05 % a day); ETH flat 0.05 % a day throughout. Funding is charged only on the open position, never on cash.
- Written down before the first run: windows, range rule, endpoints, stop criteria. The one thing the pre-registration got wrong is the point of this text — more below.
Why it doesn't get liquidated
| Leverage | BTC liquidated | ETH liquidated | Rate at 5× |
|---|---|---|---|
| 1× | 0 of 35 | 0 of 35 | — |
| 2× | 0 of 35 | 0 of 35 | — |
| 3× | 0 of 35 | 0 of 35 | — |
| 5× | 1 of 35 | 0 of 35 | BTC 2.9 %, 90 % interval 0.6 to 11.8 % |
The pre-registration expected liquidations to climb with leverage. They don't, and the reason is arithmetic, not luck.
A long grid places its buy orders below the entry. Whatever sits above the entry is never bought. With the entry in the middle of the range — which is where a range built from past volatility puts it — the grid can deploy at most about half of its notional. Call that share f.
Equity at price p is margin − deployed + coins × p. The margin is gone when the deployed amount exceeds the margin, that is when leverage × f > 1. With f ≈ 0.5:
- 2× deploys at most 1.0 × margin. Equity is always coins × p > 0. It cannot be liquidated by price, only by funding, and that takes years.
- 3× deploys 1.5 × margin against 2 × margin of credit. Liquidation needs the coins to lose about two thirds of their average purchase price — within the 90 days.
- 5× deploys 2.5 × margin against 4 × margin of credit. The coins need to lose about 40 % against the average purchase price.
That last one happened once: BTC, February to May 2020. It came close twice more without triggering. ETH from April 2022, 5×: the margin was down 97.6 % at the worst point and finished at −47.0 %. BTC from November 2018, 5×: down 90.9 % at the worst point, finished at −75.6 %.
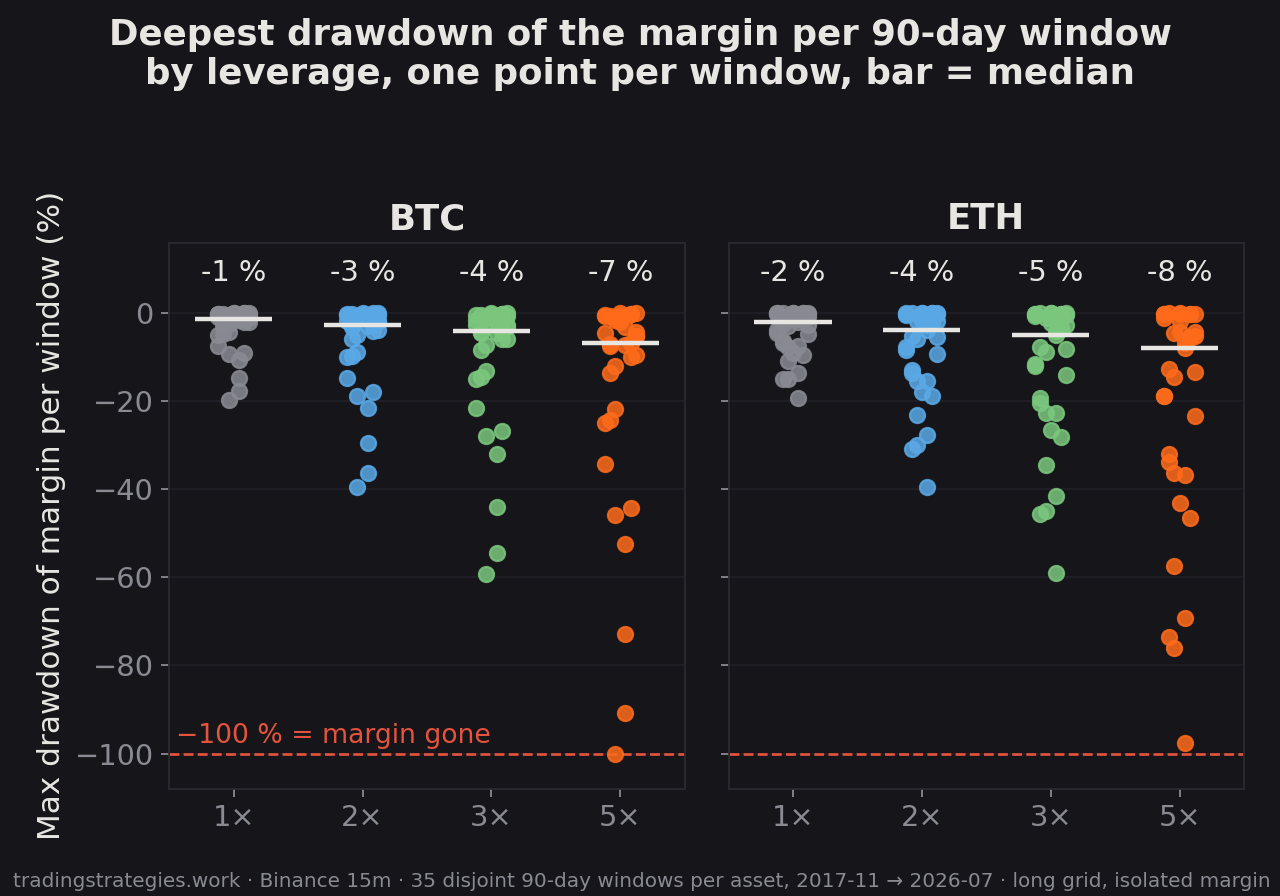 Chart 1: how much of the margin was gone at the worst point of each window. Bars are medians. n = 35 per group. The dashed line is liquidation.
Not getting liquidated is not the same as not losing the money.
What the leverage does instead
It multiplies the depth of every hole. Maximum drawdown of the margin per window, medians, with the paired difference to 1×:
| Asset | 1× | 2× | 3× | 5× | Difference 5× vs 1× (median, 90 % interval) |
|---|---|---|---|---|---|
| BTC | −1.3 % | −2.6 % | −3.8 % | −6.3 % | −5.0 pp [−7.6, −1.1] |
| ETH | −1.7 % | −3.4 % | −5.0 % | −8.0 % | −6.3 pp [−14.8, −3.0] |
The medians look harmless because half the windows are up-windows in which a long grid never buys. Split by the direction of spot: in the 16 BTC windows where spot fell, the median drawdown of the margin was −4.8 % at 1× and −24.6 % at 5×. In the 18 ETH down-windows, −5.7 % against −28.6 %.
And the tail: at 5×, the margin lost half or more of its value at some point in 4 of 35 BTC windows and 5 of 35 ETH windows. At 1×, in none.
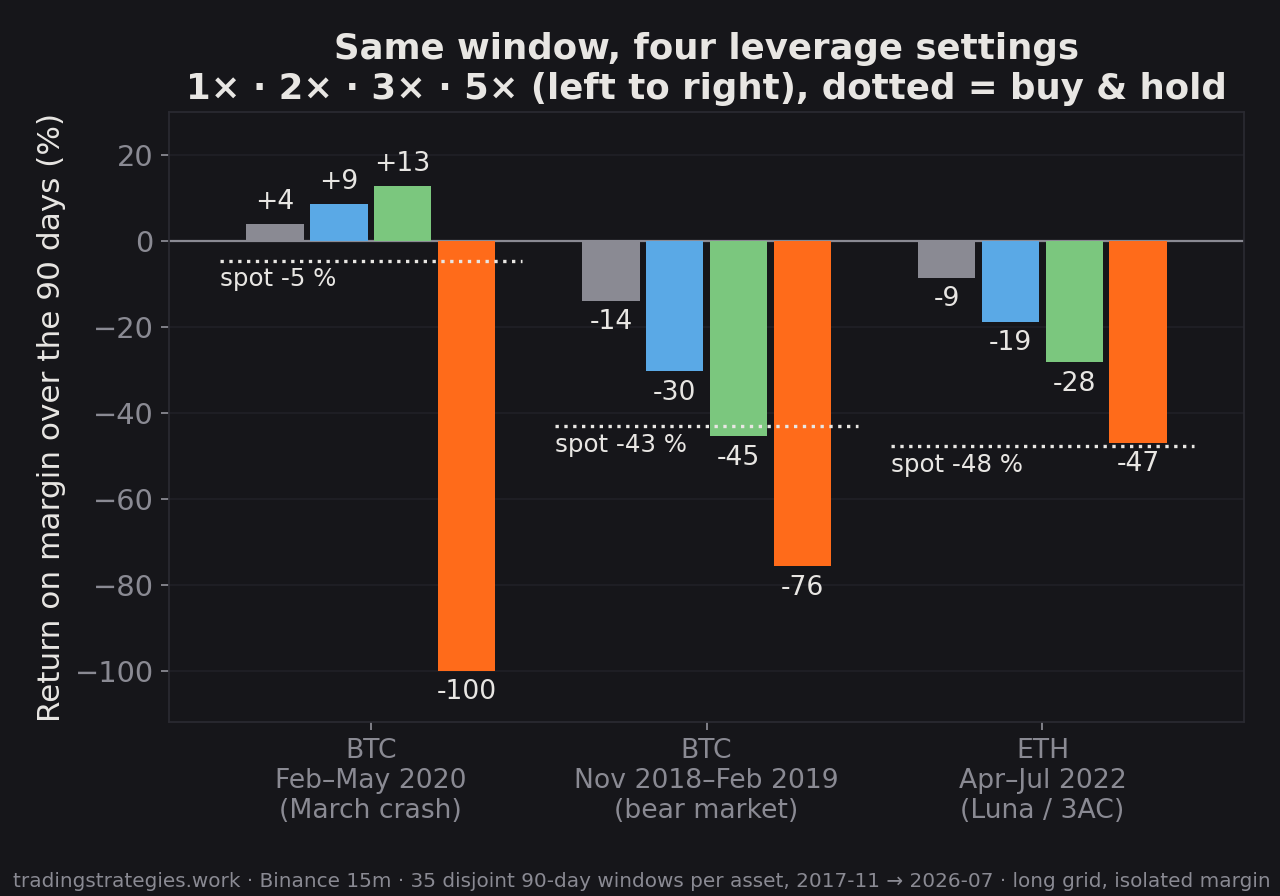 Chart 2: three windows, four leverage settings each. Same candles, same range, same bot.
The November-2018 BTC window is the one to look at. Spot lost 43.1 %. The grid at 1× lost 13.9 % — it was mostly in cash, as a grid is. At 2× it lost 30.3 %, at 3× 45.4 %, at 5× 75.6 %. No liquidation in any of them. Every rung of leverage bought more of the same falling asset with borrowed money and then paid funding on it.
The return: leverage multiplies a small number
Median return on the margin over 90 days:
| Asset | 1× | 2× | 3× | 5× |
|---|---|---|---|---|
| BTC | +0.36 % | +0.71 % | +1.06 % | +1.55 % |
| ETH | +0.21 % | +0.15 % | +0.23 % | +0.39 % |
On BTC the difference to 1× is measurable: +0.30, +0.64 and +1.23 percentage points at 2×, 3× and 5×, and each interval clears zero after correction for the three comparisons. On ETH the intervals all touch zero; nothing there can be told apart from no effect.
Measurable is not the same as meaningful. The 1× long grid earns 0.36 % in a typical 90-day window. Five times that is still 1.55 %. What grows faster than the median is the spread: the interquartile range of BTC window returns is 0.0 to 1.1 % at 1× and 0.0 to 4.6 % at 5×; the worst window goes from −13.9 % to −100 %, the best from +4.0 % to +16.0 %.
Whether the grid beats holding the coin does not change with leverage either: BTC 48.6 % of windows at 1× and at 5×, ETH 54.3 % at both.
Funding arrives at the worst moment
A long grid pays funding on the coins it holds. It holds coins after buying on the way down. So the funding bill is largest in exactly the windows where the grid is already losing.
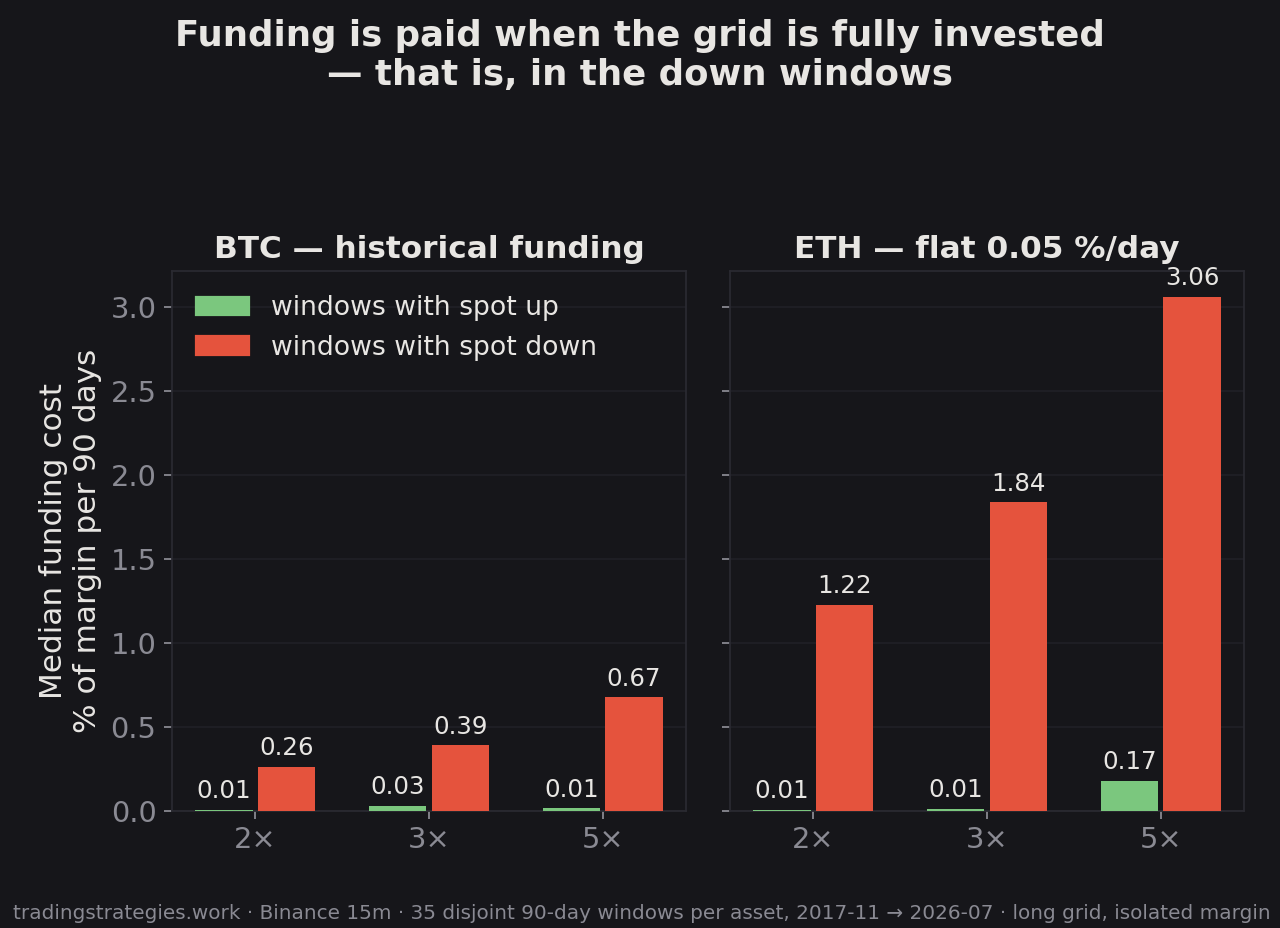 Chart 3: funding paid per window, medians. BTC uses the recorded daily average of three exchanges; ETH a flat 0.05 % a day, which the recorded BTC rate exceeded on 13.4 % of days.
BTC at 5×: 0.01 % of the margin in up-windows, 0.65 % in down-windows. In the November-2018 window the funding alone took 6.1 % of the margin. On ETH with the flat rate, 3.06 % of the margin in a median down-window at 5×. Whoever wants to know where that money goes: the other side of the funding payment.
One exception cuts the other way. In the 2020 window, BTC funding was net negative — the grid at 2× and 3× was paid 0.8 and 1.2 % of its margin over the 90 days for holding. That did not save the 5× version.
The objection
"So 2× can't be liquidated, and 3× only in a crash the size of March 2020. That's free extra return."
Three things stand against it. First, the extra return is measured from a base of 0.36 %; the leverage multiplies a rounding error. Second, the drawdown of the margin scales with the leverage too, and it scales in the windows where you would least like it to: 24.6 % against 4.8 % in BTC down-windows at 5×. Third, the sample contains one March 2020. The 5× liquidation rate of 2.9 % has a 90 % interval that reaches 11.8 %, and the margin lost half its value in roughly one window in eight. Thirty-five windows per asset are enough to see the shape; they are not enough to call a tail rare.
What a leveraged grid does, in one sentence: it takes a bot that is mostly in cash and makes it mostly in debt, in the windows where the coin is falling.
What you can do with this
- Compute f. Count the grid levels below your entry and divide by all levels. If leverage × f ≤ 1, price alone cannot liquidate you. That is not safety, it is the reason the number to watch is the drawdown of the margin, not the liquidation price.
- Look at the down-windows. The medians are flattered by the up-windows in which a long grid does nothing. Your risk lives in the other half.
- Price the funding into the bear case. It is small when you are in cash and large when you are not — which is the same moment the grid is underwater.
- Test it yourself. The grid backtest on this site runs the same engine at 1×; set a long grid and read off how much of the capital ever leaves cash — that is f. The leverage arm behind these numbers is not in the web tool yet.
What this does not say
- Long grid only. Neutral and short grids deploy differently; f is not 0.5 there and nothing above transfers.
- The 1× anchor is the long grid, not the neutral grid of the September study. The two sets of numbers are not comparable.
- BTC funding before September 2019 (7 of 35 windows) is the flat rate; ETH throughout. Real perpetual funding on ETH has been both higher and lower.
- Fifteen-minute candles, liquidation at the candle's low, no slippage, a flat 0.5 % maintenance margin instead of exchange-specific tiers and insurance-fund rules. A real venue's liquidation price differs from this one; the drawdown of the margin before it does not.
- One crash of March-2020 size in the sample.
FAQ
Can a 2× long grid be liquidated at all? Not by price, if the entry sits in the middle of the range: it deploys at most about half its notional, which equals the margin. Only funding can erode it, and at 0.05 % a day that takes years. With the entry near the top of the range, f rises and 2× becomes liquidatable — the study's potency test shows exactly that.
Why did the 5× bot in February 2020 get liquidated when 3× finished at +13.1 %? Same candles, same buys. At 3× the credit was 2× margin against 1.5× margin deployed; at 5× it was 4× margin against 2.5× deployed. When BTC fell 59.5 % from the entry on day 38, the 5× position's equity crossed zero, the 3× position's did not — and 3× then rode the recovery.
Is the higher median return at 3× and 5× on BTC real? The paired differences are +0.64 and +1.23 percentage points with 90 % intervals that clear zero after Holm correction. It is real and it is small: five times a 0.36 % median. On ETH it is not distinguishable from zero.
How was funding modelled? Charged once per UTC day on the coins held at the end of the previous day, using that day's rate: BTC from the recorded daily average of Binance, Bybit and OKX (median 0.021 % a day, 95th percentile 0.15 %), ETH a flat 0.05 %. Charged only while the grid holds coins.
What would change the conclusion? A grid whose entry sits high in its range (f near 1), a leverage above 5×, or a window set with more crashes of the 2020 kind. In all three cases the liquidations rise — and the drawdown-of-margin argument stays the same.
No investment advice, no recommendation, no forecast. Historical patterns are not a promise. Pre-registration, script and results: prereg-grid-leverage-sweep-v1, scripts/grid-leverage/run-sweep.ts, docs/research/grid-leverage/.
Study the Past — Improve your Future 🥋