
A grid bot buys on the way down and sells on the way up inside a fixed range. Anyone running one instead of holding usually wants to know one thing: am I protected in a crash, or do I just miss the rally? And how much rides on the range you have to set in advance?
The short answer from 138 measured cases: protected, in every single one. Only not because the bot trades, but because it never invests 52 to 65 % of the money. Half a portfolio in cash falls less far than a full one. The bill for that comes when the market runs.
The May post on this site showed two single cases, among them a BTC range of $80,000–$130,000 that finished 16 months at +0.45 % while buy & hold lost 19.15 %. Two windows, both ranges chosen with the chart already known. Here is the measurement: 35 disjoint 90-day windows per asset since 2017, ranges built only from data available before each window.
The setup, in numbers you can check
- Data: Binance spot candles, 15 minutes, BTCUSDT and ETHUSDT, 17 Aug 2017 to 31 Aug 2026. 316,411 candles per pair, 0.18 % missing.
- Windows: 35 disjoint 90-day windows per asset, the first starting 16 Nov 2017, the last ending 2 Jul 2026. Plus 105 overlapping windows at a 30-day step as a robustness check.
- Two range rules, decided before the window. R1: low and high of the closes over the previous 90 days. R2: last close ± 1.5 standard deviations of the 90-day return distribution, scaled to 90 days. A third rule, R3, uses the window's own minimum and maximum. It is not tradable and exists only to price hindsight.
- Bot: 50 arithmetic grids, 0.075 % fee, $10,000, entry at the window's first close. The same engine as the grid backtest on this site.
- Rules, endpoints and stop criteria were written down before the first run, as in the Wyckoff spring study. Two runs produce the same hash.
- One rule for this text: every grid number sits next to the buy & hold number from the same window.
The drawdown: yes, and it is mechanical
Maximum drawdown per window, median across windows. The difference column is the median of the paired per-window differences, not the difference of the two medians before it; that holds for every table in this text:
| Asset | Rule | Grid | Buy & hold | Difference (median, 90 % interval) | Windows with flatter grid |
|---|---|---|---|---|---|
| BTC | R1 | −9.5 % | −28.1 % | +13.6 pp [10.9, 15.3] | 34 of 34 |
| BTC | R2 | −13.1 % | −27.2 % | +13.2 pp [11.9, 14.9] | 35 of 35 |
| ETH | R1 | −15.3 % | −37.3 % | +16.5 pp [14.6, 20.5] | 34 of 34 |
| ETH | R2 | −15.6 % | −36.3 % | +18.7 pp [17.2, 19.3] | 35 of 35 |
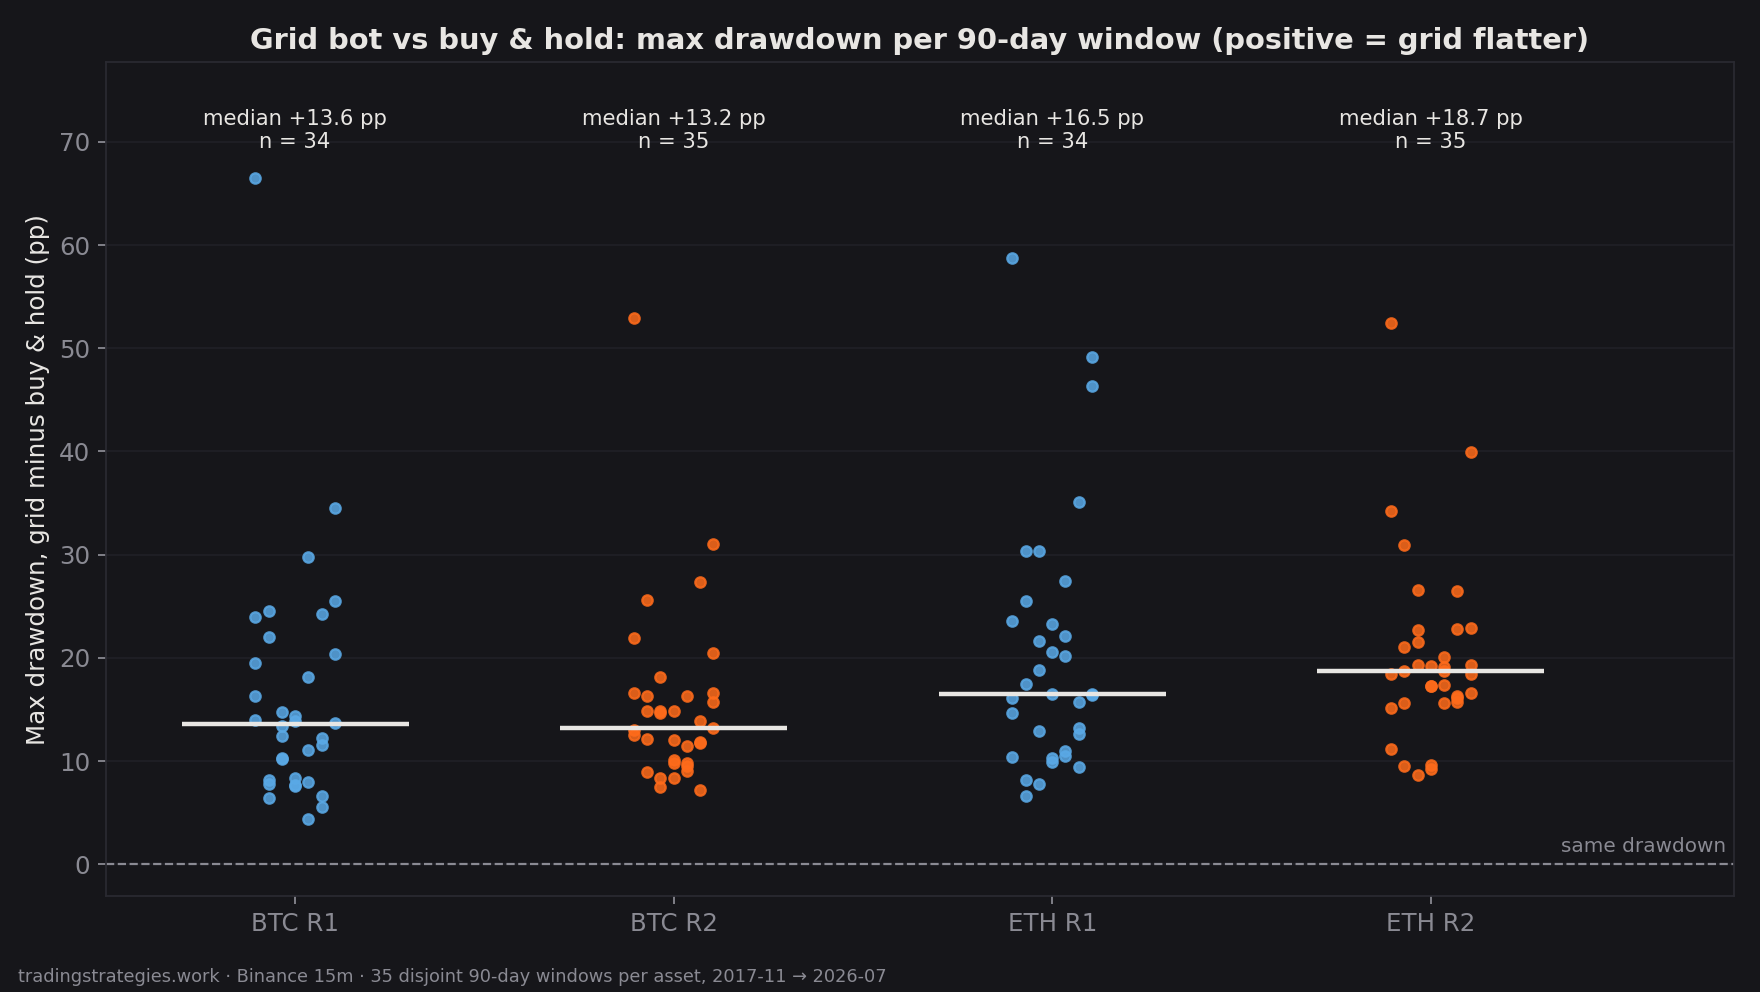 Chart 1: the grid's drawdown advantage per window. Each point is one 90-day window, the bar the median. n = 34/35 per group, Binance 15 min, 2017-11 to 2026-07.
In 138 of 138 window-rule combinations the grid drawdown was flatter. That is not a feat of the bot. It starts 35 to 48 % in coins with the rest in cash, and each buy on the way down moves one fiftieth of the capital. A position that is never fully in the falling asset cannot fall as far as one that is. The protection is a property of partial exposure, not of the trading logic.
And it is partial. In the worst BTC window (starting 11 Nov 2018) buy & hold lost 43.1 %, the grid bot with R2 lost 34.1 %. Its drawdown was −41.8 % against −51.3 %. Anyone expecting an exit in a bear market gets a cushion.
The bill: where it shows up and where it doesn't
Return difference, grid minus buy & hold, over 90 days:
| Asset | Rule | Grid (median) | Buy & hold (median) | Difference (median, 90 % interval) |
|---|---|---|---|---|
| BTC | R1 | +1.8 % | +1.3 % | +3.7 pp [−11.4, +5.3] |
| BTC | R2 | +4.3 % | +1.6 % | +2.6 pp [−5.8, +7.2] |
| ETH | R1 | +2.5 % | −1.7 % | +5.5 pp [−20.2, +8.7] |
| ETH | R2 | +6.2 % | −2.2 % | +6.2 pp [−10.3, +12.2] |
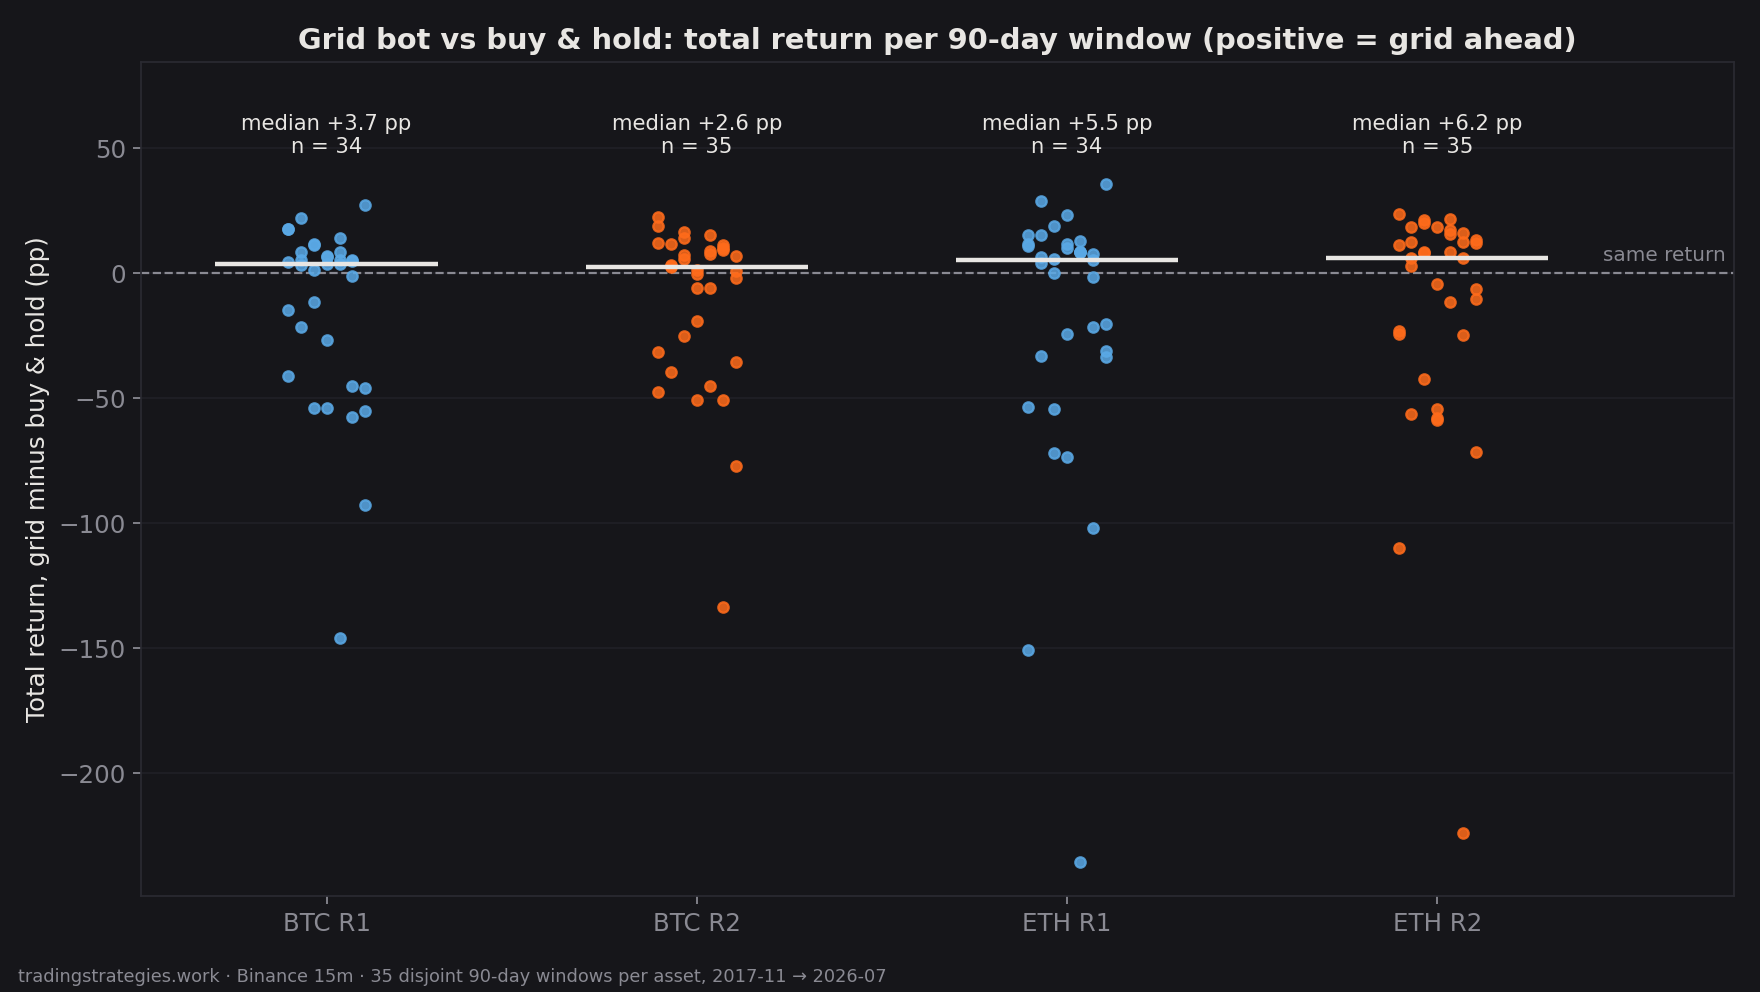 Chart 2: return difference per window. The median sits just above zero; the outliers below are the rally windows. Same windows as chart 1.
Every interval covers zero. Over a typical 90-day window the return difference cannot be told apart from zero. The pre-registration expected a negative median, a hedge that is paid for. It does not show.
The median hides a clean split, though. In windows where buy & hold ended negative, the grid bot beat it in 16 of 16 (BTC, R1), 16 of 16 (BTC, R2), 17 of 17 (ETH, R1) and 18 of 18 (ETH, R2). In windows where buy & hold ended positive, in 4 of 18, 4 of 19, 3 of 17 and 2 of 17.
So the bill arrives rarely, but in full. In the window starting 31 Oct 2020, buy & hold on BTC made +146.3 %, the grid bot with R2 +13.0 %, with R1 +0.5 %. On ETH, +248.9 % against +24.8 %. The bot with R2 had sold its last coins after 24 days and sat outside the range, the one with R1 on the first day.
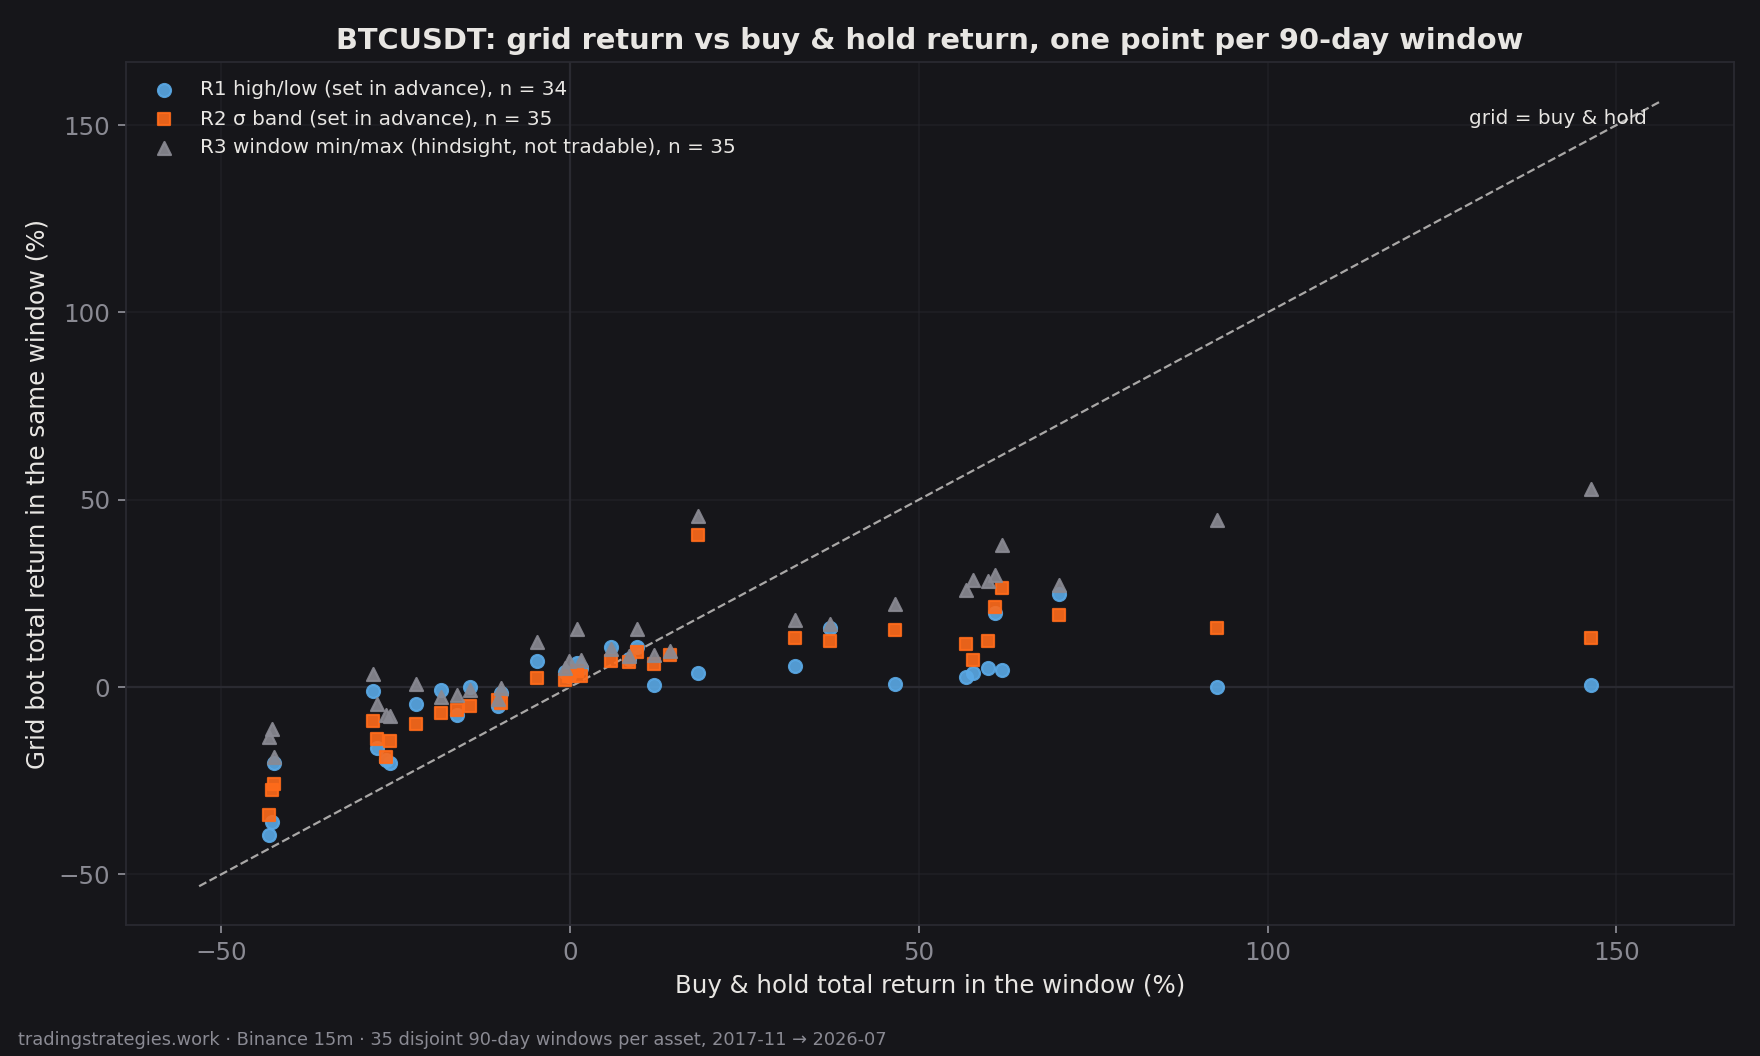 Chart 3: BTC, one point per window. Left of the diagonal the grid is ahead, right of it buy & hold. The grey triangles are the hindsight range R3, not tradable.
What remains is a narrower band of outcomes. The interquartile range of window returns is 9.3 to 28.8 pp for the grid and 59.2 to 66.3 pp for buy & hold. The bot cuts both ends.
The range rule: what it changes and what it doesn't
The range is held to be the critical variable of a grid bot; the May post said so too. For the drawdown, that does not show. The paired difference in drawdown advantage between R1 and R2 is +0.5 pp [−2.0, +2.5] on BTC and −0.7 pp [−2.3, +2.4] on ETH. Both rules protect the same.
What differs is behaviour inside the window:
| R1 (high/low) | R2 (σ band) | |
|---|---|---|
| BTC: price leaves the range | 27 of 34 windows (16 up, 11 down) | 14 of 35 (7 up, 7 down) |
| BTC: median days until it leaves | 14 | 37 |
| ETH: price leaves the range | 28 of 34 (14 up, 14 down) | 15 of 35 (8 up, 7 down) |
| ETH: median days until it leaves | 18 | 43 |
| BTC: fills per 90 days (median) | 313 | 163 |
| Coin share at start (median, span) | 35 % (2–77 %) | 48 % (41–50 %) |
The range rule decides how often the bot sits outside its range, how many fills you pay fees on and how lopsided it starts. Not how deep the drawdown goes.
What hindsight was worth
R3 knows the window's minimum and maximum before it begins. Against the tradable rules that is worth a median +6.7 pp of return per 90 days over R1 on BTC [4.3, 12.2] and +7.0 pp over R2 [4.6, 9.4]. On ETH, +9.8 pp and +8.5 pp. That is the number the May post was missing: both of its ranges were R3-type.
Two reading notes if you put the May numbers next to these. First, the engine counts fills, each buy and each sell separately. The 1,395 "trades" of 2024 are about 700 round trips. Second, the engine in May liquidated when price left the range. Today it pauses, like KuCoin, and trades again once price returns. Every number here comes from today's mechanics.
The strongest objection
"90 days is too short. A grid bot runs for a year, and during a pause you hold the coins anyway."
The 90 days are exactly what keeps the ranges honest. Even within that window, price leaves the R1 range in 79 % of cases. A longer window makes any pre-set range hold less often, not more. The 105 overlapping windows give the same medians: drawdown advantage of 12.7 and 13.7 pp on BTC, 18.0 and 18.5 pp on ETH.
A second objection concerns the measurement itself: no slippage, a 0.075 % fee, a path model inside the 15-minute candle. Every grid return here is an upper bound. That works against the bot, not for it.
What this means for your own decision
- A grid bot delivers what the data show: a narrower band of outcomes and a flatter drawdown, in each of the 138 cases measured.
- The bill for that comes in the rally windows. There the bot kept up in 2 to 4 of 17 to 19 cases. If you need the rally, you don't need a grid bot.
- Choose the range rule by the behaviour you can live with: R1 tight, busy, out early. R2 wide, calm, out later. The protection is the same.
- Comparing against a hindsight range is misleading. It sat 7 to 10 pp per quarter above what any rule known in advance achieved.
If you have a specific range in mind, run it in the grid backtest against the same candles, BTCUSDT and ETHUSDT without a login.
The open question: if the range rule doesn't set the protection, what sets how much of the rally you keep? Is there a rule known in advance that keeps more than a third of it without giving back the drawdown advantage?
FAQ
Why 90-day windows? Because the range is set from 90 days of lead-in before the window, and disjoint windows give independent observations. 35 windows per asset clear the pre-registered minimum of 30. Overlapping windows run only as a robustness check.
What counts as a trade? The engine counts fills: every buy and every sell separately. A round trip is two fills. The median is 313 fills per 90 days with R1 on BTC and 163 with R2.
Why is the median return difference zero if the bot misses the rallies? Because it wins in the falling windows: 67 of 67 windows with negative buy & hold. The large losses against buy & hold concentrate in a few rally windows, which don't move the median but do move the lower end of the interval.
Is this KuCoin's behaviour? The allocation and the pause on leaving the range follow KuCoin's grid mechanics. Slippage and partial fills are not modelled; the returns are upper bounds.
Are the numbers net of fees? Yes, 0.075 % per fill. The buy & hold side carries no fee; it buys once.
Does this hold for other coins? BTC and ETH were measured. ETH confirms the sign and magnitude of BTC on every endpoint.
Why do numbers from the grid backtest on the site differ slightly? The study cuts its windows on the 15-minute candle; the tool takes calendar dates. For the window starting 31 Oct 2020 the tool shows +150.0 % buy & hold, the study +146.3 %. The direction of the findings does not change.
Not investment advice, not a recommendation, not a forecast — historical patterns are no guarantee.